


Surge in U.S. Executions Exhibits Huge White-Victim Preference
DP3 Analysis Finds White-Victim Preference Masks Significant Bias Against Black Defendants

When Tennessee executed Oscar Smith on May 22, few commentators suggested that his case provided evidence that U.S. states wield the death penalty as an implement of power to reinforce the racial hierarchy in the U.S. social order. After all, Smith — a 75-year-old white man — had been convicted and condemned for the murders of his estranged wife and her two sons, who also were white.
But that is precisely what a Death Penalty Policy Project analysis of execution and homicide data in the United States shows. U.S. states are in the midst of an historic run of executions that exhibit an unprecedented white-victim preference, and the primacy given white-victim cases masks a significant underlying bias against black defendants.
Smith was the 1,626th person executed in the United States since the U.S. Supreme Court permitted executions to resume in July 1976.1 In that time, 1,236 executions (76.0%) have been carried out in cases involving only white victims. That percentage is remarkable, given that whites comprise barely half of all homicide victims in the country.2 White-victim homicides are thus 1.5 times more likely to result in executions than one would expect from the overall victimization rates,3 and murders involving victims of other races are half as likely to result in executions than the homicide numbers would suggest.4 Overall, homicide cases with white victims are three times more likely to result in executions than homicides with no white victims.5
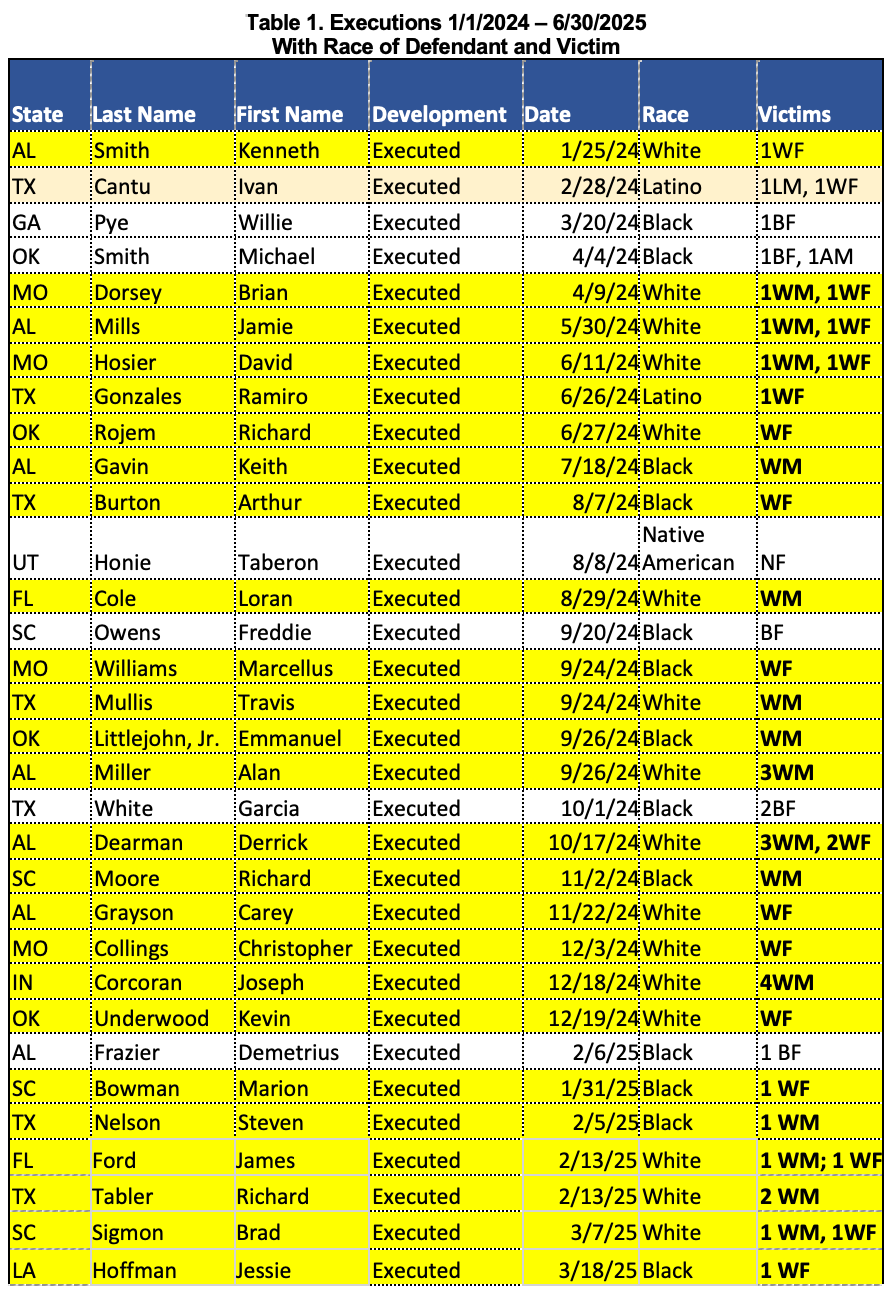
Moreover, as the nationwide attack on diversity, equity, and inclusion has intensified, the white-victim disproportionality in executions has gotten worse. Thirty-eight of the 44 executions since January 1, 2024 (86.4%) have involved at least one white victim and 37 (84.1%) have involved only white victims. (Table 1, below.) Twenty-four of the last 25 executions during the current execution surge in the U.S. (96.0%) have been in cases with only white victims. The last 18 of those executions, the four scheduled this week, and the other executions currently scheduled before the end of June, also involve only white victims. All told, if those six pending executions are carried out, ten different states will have combined to conduct an unprecedented 24 consecutive executions of defendants convicted of killing only white victims, the longest spree of executions involving just one race of victims in the modern history of the U.S. death penalty.

Those who have looked closely at the U.S. death penalty have consistently found that the race of a homicide victim influences every step of the criminal legal process,6 from which crimes are more likely to be investigated, solved, capitally charged, and prosecuted as death penalty cases to how juries view the evidence against a defendant at trial and sentencing, and who gets sentenced to death, has their death sentence upheld on appeal, and ultimately is executed.7 The impact at each stage of the process is additive, with each new layer of bias increasing the disparity in case outcomes.
For those to whom facts matter, the historic white-victim execution spree that is currently underway provides important insight into whose lives matter more in the administration and enforcement of criminal law. But do not be fooled into believing that the data reflect merely a preferential “protection” of white lives. DP3’s comparison of U.S. executions to homicide data spanning the years in which the vast majority of the murders leading to execution occurred shows that the race-of-victim bias both masks and works in tandem with a strong anti-Black-defendant bias.
Methodology
To assess the scope of race-of-defendant/race-of-victim disparities in carrying out the death penalty across the country, the Death Penalty Policy Project compared Bureau of Justice Statistics data on murders between 1976 and 2005 with the Legal Defense Fund’s Death Row USA dataset of U.S. executions from 1977 through June 30, 2025. (For data purposes, we assumed that the executions currently scheduled through June all go through.) At first blush, these may seem to be peculiar sets of data to compare, but here is why the choice makes sense.
According to the latest available Bureau of Justice Statistics data, the average length of time a death sentenced prisoner had been on death row as of December 31, 2022 was 21.0 years.8 BJS reported that the average length of time between sentence and execution in the execution cases in 2022 was 249 months (20 years, 9 months), and the overall average time lapse between sentencing and execution for the entire period between 1977 and 2022 was 149 months (12.4 years).9 Given that both the average length of time death-row prisoners are currently spending on death row and the current time lapse between death sentencing and execution are approximately two decades, contrasting execution data with murder data that has an end date twenty years before seems like a fair comparison.
The Murder-to-Execution Comparison by Race of Victim and Offender
The Bureau of Justice Statistics reported 403,183 murders in the United States in the three decades between 1976 and 2005 for which it was able to identify both the race of the victim and the race of the alleged perpetrator.10 Assuming that the six executions currently pending in the United States in June are carried out, 1,632 people will have been put to death in the United States since executions resumed in January 1977. Overall, that translates to one execution for every 247.05 murders for which the race of the victim and alleged perpetrator are known.
The execution rate is much higher in white-victim cases. When the murder victim was white, one in every 158.80 murders resulted in an execution. By contrast, when the murder victim was black, one in every 475.01 murders resulted in an execution. The bottom line: an accused perpetrator is three times more likely to be executed when the victim is white than if the victim is black.
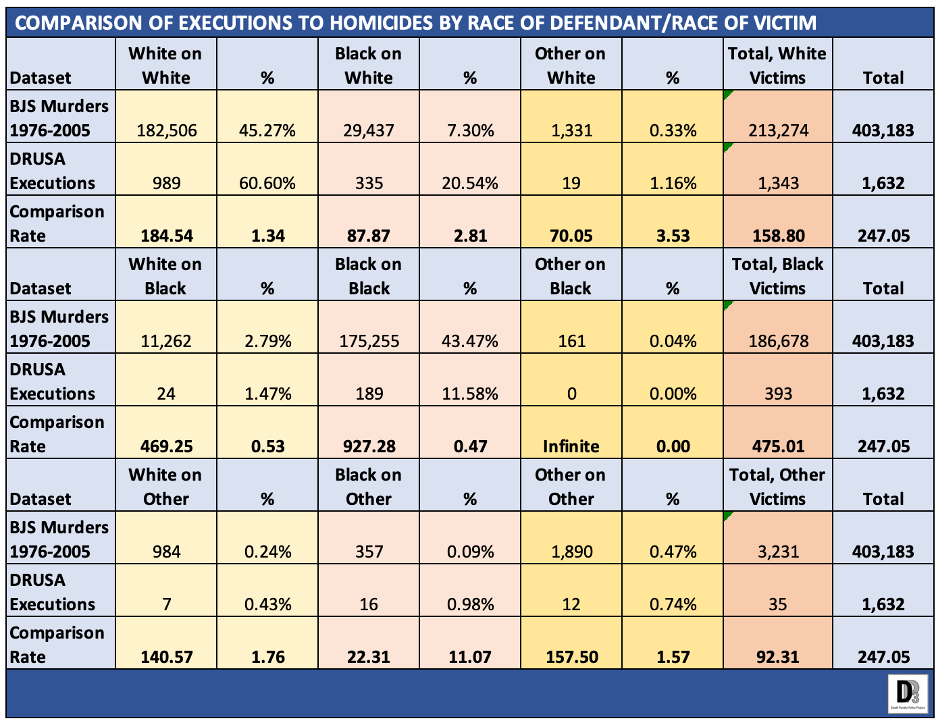
Comparing race-of-offender/race-of-victim murder combinations produces additional evidence of white-victim and anti-black-defendant bias. The most common race-of-offender/race-of-victim homicide combination is the killing of a white victim by a white perpetrator. According to BJS, there were 182,506 such murders between 1976 and 2005, making it 6.2 times more common than the 29,437 murders of white victims by black perpetrators. 989 of the white-perpetrator murders resulted in executions, or one for every 184.54 murders. 335 of the black perpetrator murders resulted in executions, or one for every 87.87 murders. When the victim was white, the likelihood that a defendant would be executed was more than double if he was black than if he was white.11
The extent of white-victim favoritism can also be measured by comparing the difference in the rates at which accused offenders are executed depending upon the race of the victim. Again, one in 184.54 white-offender cases resulted in executions when the victim was white. By contrast, the 11,262 white-offender/black-victim cases have produced 24 executions, or 1 in every 469.25 murders. When the offender is white, it is 2.54 times less likely that a defendant will be executed if the victim is black than if the victim is white.12
For black defendants, the likelihood of execution shifted more than tenfold depending upon the race of the victim. Although a black offender was 6.0 times more likely to have a black victim than a white victim, 1.77 times more black defendants have been executed on charges of killing white victims than in black-victim cases. The BJS homicide data report 175,255 black-offender/black-victim murders. The LDF data report 189 black-defendant/black-victim executions. That is one execution for every 927.28 black-defendant/black-victim murders, as compared to one execution for every 87.87 murders with a black defendant and a white victim. Thus, a defendant who is black is 10.55 times more likely to be executed when the victim is white than when the victim is black.
The disproportionate impact of the race of the victim and the race of the perpetrator on executions can also be seen by comparing the percentages of murders with a particular race-of-perpetrator/race-of-victim combination with the percentage of executions involving that same racial combination of victim and offender. 45.27% of U.S. murders between 1976 and 2005 involved a white perpetrator killing a white victim. However, white-on-white killings account for 60.60% of all executions, a rate that is 1.34 times higher than their overall percentage of murders. By contrast, only 7.3% of U.S. murders involve black perpetrators. But black-defendant/white-victim cases account for 20.54% of all executions, nearly triple the rate (2.81) at which these murders take place. So, while white-victim cases are overrepresented among the murder cases that advance to execution irrespective of the killer’s race, the rate of overrepresentation in executions more than doubles if the condemned defendant is black.13
Attempting to quantify how many fewer executions there would have been in the U.S. if the white-victim overrepresentation were eliminated is guesswork. But here is a simple scenario that illustrates the white-victim effect on executions.
If defendants were executed at the same rate for murders of white victims as they have been executed for murders of black victims, then there would be one execution of a white defendant for every 469.25 murders of a white victim, rather than one execution for every 184.54 white-victim murders. Instead of 989 executions of white defendants for the deaths of white victims, there would have been 389. That’s a 60.7% reduction and 600 fewer executions of white defendants. There also would be one execution of a black defendant for every 927.28 murders of a white victim, rather than one execution for every 87.87 white-victim murders. Instead of 335 executions of black defendants for the deaths of white victims, there would have been 32. That’s a 90.4% reduction, and 303 fewer executions of black defendants. In this scenario, executions in the U.S. over the past fifty years would have been reduced by more than half. Instead of 1,632 executions, there would have been about 729.
Case Examples: Non-Discriminatory Death-Penalty Charging Practices Still Produce Discriminatory Death Sentencing Outcomes
Some may be tempted by the numbers to make the perverse argument that the systemic white-victim discrimination in the death penalty process actually benefits African Americans because black death-row prisoners make up one-third of all U.S. executions while black perpetrators commit one-half of all U.S. murders. But it is disingenuous to justify policing practices that systemically under-investigate and under-solve murders of black victims or prosecutorial charging practices that over-fill capital dockets with white-victim cases as somehow being beneficial to the black community.
Indeed, this race-of-victim discrimination skews the data in so many of the death penalty jurisdictions that it masks the death penalty’s race-of-defendant discrimination. To more clearly see the race-of-defendant discrimination, it is useful to find the rare jurisdictions in which the evidence shows no statistically significant discrimination in death penalty charging practices. Those jurisdictions show that even when the pipeline into capital prosecution is nominally non-discriminatory, the outcome of capital trials is. And in those jurisdictions, the evidence shows discrimination based upon the race of the defendant.
In October 2018, in State v. Gregory,14 the Washington Supreme Court unanimously ruled that the state’s capital punishment statute was “imposed in an arbitrary and racially biased manner” that violated the state constitutional prohibition against “cruel punishment.” The court relied heavily upon a study of twenty-five years of Washington State capital prosecutions in making that determination.15 The researchers in that study found no statistical evidence of racial discrimination in prosecutorial decision on whether to seek the death penalty. Nonetheless, after controlling for all other variables in their regression analysis, they found that Washington juries were 4.5 times more likely to impose a death sentence upon a black defendant than on a white defendant in a similar case.16

Studies of the administration of the death penalty in Philadelphia illustrate the impact of race-of-victim and race-of-defendant bias. Racial discrimination was not present in charging practices in the city for one important reason: prosecutors sought the death penalty indiscriminately.
The effect? In 2001, Philadelphia had the highest per capita death-row population of any of the 70 largest death-penalty counties in the United States and more African Americans on death row than any other U.S. county.17 A landmark study of capital prosecutions in the city led by Professor David Baldus18 found both race of defendant discrimination and strikingly inappropriate capital sentencing decisions based upon the race of the victim.
Pennsylvania law mandates that a death sentence be imposed whenever the jury unanimously finds one or more aggravating circumstances to be present in a case but none of the jurors finds any mitigating circumstances to be present. Mitigating circumstances — that is, reasons for life — are designed to embrace “the diverse frailties of humankind” relating to a defendant’s character, background, and record and the circumstances of the offense so that capital defendants will be treated “as uniquely individual human beings.”19 They are supposed to be an entirely defendant-based inquiry.
Professor Baldus found that something entirely different was going on: the victim’s race was hijacking the supposedly defendant-centered mitigation inquiry. In Philadelphia capital sentencing decisions, the odds of a death verdict based upon a jury no-mitigation finding increased by a factor of 4.3 if the victim was white.20
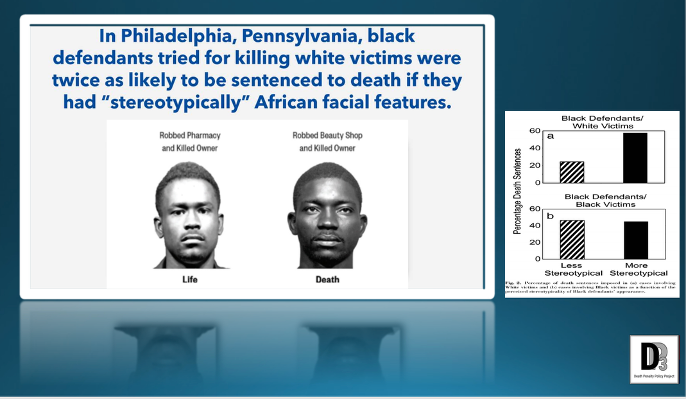
White-victim cases also infected the capital sentencing process for black defendants based upon the irrelevant factor of a defendant’s physical appearance. Using the Baldus Philadelphia data, a research team led by Stanford social psychologist Dr. Jennifer L. Eberhardt examined police photos of African-American defendants who had been capitally prosecuted. After rating the appearance of the defendants on a scale of “stereotypically Black” facial features, they reviewed capital sentencing outcomes based upon the race of the victim. They found that what a black defendant looked like made no difference in cases in which the victim also was black. However, in cases involving white victims, what the defendant looked like may have made the difference between life and death. Defendants who had prototypically African facial features — darker skin, broader nose, and thicker lips — were twice as likely to be sentenced to death than were black defendants who had lighter skin, a narrower nose, and thinner lips.21
After rating the homicides in the database for their perceived severity, Professor Baldus was able to assess the impact of the race of the defendant/race of victim effects on Philadelphia death sentences. He found that, at all levels of perceived severity, the racial combination mostly like to produce a death verdict was a black defendant and a non-black victim. The inverse was also the case: the racial combination least likely to result in death was the interracial killing of a black victim. At all levels of a murder’s perceived severity, death sentences were more likely to be imposed if the victim was white, irrespective of the race of the defendant, and more likely to be imposed on black defendants, irrespective of the race of the victim.

The historic white-preference preference present in the ongoing spree of executions in the United States reminds us whose lives death penalty states value more. But that veil of white-victim protectionism masks a deeper racial bias endemic to the U.S. death penalty that is clear from homicide and execution numbers and numerous death penalty studies: black defendants’ lives also matter less.
See Death Row USA, Spring 2025, at 2, Legal Defense Fund (as of April 1, 2025) (“Spring 2025 DRUSA”), supplemented by Death Penalty Policy Project execution monitoring, April 1, 2025 to present (“DP3 Monitoring”).
James Alan Fox & Marianne W. Zawitz, Homicide trends in the United States, 1976-2005, Homicide Victims by Race, at 60, U.S. Dept of Justice, Office of Justice Programs, Bureau of Justice Statistics (Jan. 2010) (“Homicide Victims by Race”). See the methodology discussion below for an explanation as to why I relied on these homicide numbers for my executions versus homicides comparisons.
There were 588,066 murders in the United States in the three decades between 1976 and 2005 of which 299,522 of the victims were white (50.933%). Homicide Victims by Race at 60. 1,236 of the 1,626 executions in the U.S. from 1976 to the present have been in cases with only white victims. (76.015%). Spring 2025 DRUSA at 2; DP3 Monitoring. Comparing the percentage of executions involving only white victims to the percentage of homicides with white victims, we get: 76.015 ÷ 50.933 = 1.492.
288,544 of the 588,066 homicides in the United States between 1976 and 2005 had non-white victims (49.067%). Homicide Victims by Race at 60. 390 of the 1,626 executions through March 31, 2025 were in cases with at least one non-white victim (23.985%). Spring 2025 DRUSA at 2; DP3 Monitoring. Comparing the percentage of executions involving only white victims to the percentage of homicides with white victims, we get: 23.985 ÷ 49.067 = 0.489. Murders in cases with non-white victims result in executions at a rate that is 2.046 times less than the rate at which they occur.
This can be calculated by dividing the comparative rate of executions to homicides in white-victim cases (1.492) by the comparative rate of executions to homicides in cases with non-white victims (0.489). The result is 1.492 ÷ 0.489 = 3.053.
Report to the Senate and House Committees on the Judiciary, Death penalty sentencing: Research indicates pattern of racial disparities., U.S. General Accounting Office (Feb. 1990). The GAO analyzed 28 studies of the impact of race on the administration of capital punishment and noted what it called a “remarkably consistent [finding] across data sets, states, data collection methods, and analytic techniques” that “those who murdered whites were … more likely to be sentenced to death than those who murdered blacks.” Id. at 5. “The race of victim influence,” the GAO reported, “was found at all stages of the criminal justice system process.” Id.
See generally Ngozi Ndulue, Enduring Injustice: The Persistence of Racial Discrimination in the U.S. Death Penalty, Death Penalty Info. Ctr. (Sept. 2020); Richard C. Dieter, The death penalty in black and white: Who lives, who dies, who decides, Death Penalty Info. Ctr. (1998). See also Jennifer L. Eberhardt, et al., Looking Deathworthy Perceived Stereotypicality of Black Defendants Predicts Capital-Sentencing Outcomes, 17 Psychological Science 383–86, at 383 (Issue 5, May 2006) (citing studies).
Tracey L. Snell, Capital Punishment, 2022 – Statistical Tables, Table 5, at 10, U.S. Dept of Justice, Office of Justice Programs, Bureau of Justice Statistics (Dec. 2024).
Id., Table 7, at 12.
The BJS data does not separately categorize Caucasian victims and alleged perpetrators based upon ethnicity, so a Latino of European ancestry is considered white and a Latino of African ancestry is considered black. The Legal Defense Fund data, on the other hand, has a separate category for Latino/a victims and defendants, but categorizes those who are black and Latinx as black. To create meaningful categories for comparison purposes, DP3 recalculated the LDF execution data using the BJS racial categories.
This is calculated by dividing the rate at which black-perpetrator/white-victim cases result in executions (29,437 murders ÷ 335 executions = 1 in 87.87 murders) by the rate at which white-perpetrator/white-victim cases result in execution (182,506 murders ÷ 989 executions = 1 in 184.54 murders). 184.54 ÷ 87.87 = 2.10.
This is calculated by dividing the rate at which white-perpetrator/white-victim cases result in executions (182,506 murders ÷ 989 executions = 1 in 184.54 murders) by the rate at which white-perpetrator/black-victim cases result in execution (11,262 ÷ 24 = 1 in 469.25). 469.25 ÷ 184.54 = 2.54.
We can determine the extent to which a black defendant’s race affects the rate of overrepresentation in white-victim executions by dividing the overrepresentation of black perpetrator/white victim cases (2.813) by the overrepresentation of white perpetrator/white victim cases (1.338). Rounding to the second decimal level, we get: 2.813 ÷ 1.338 = 2.10.
State v. Gregory, 427 P.3d 621 (Wash. 2018).
Katherine Beckett and Heather Evans, Race, Death, and Justice: Capital Sentencing in Washington State, 1981–2014, 6 Columbia J. Race & Law 77 (2016).
Id. at 100.
Robert Dunham, Racial composition of death row in the seventy most populous counties in states with the death penalty, July 16, 2001 (data on file at Death Penalty Policy Project).
David C. Baldus, et al., Racial discrimination and the death penalty in the post-Furman era: An empirical and legal overview, with recent findings from Philadelphia, 83 Cornell L. Rev. 1638 (1998) (“Baldus Philadelphia Study”).
Woodson v. North Carolina, 428 U.S. 280, 304 (1976). See Lockett v. Ohio, 438 U.S. 586 (1978); Eddings v. Oklahoma, 455 U.S.104 (1982); Skipper v. South Carolina, 476 U.S. 1 (1986).
Baldus Philadelphia Study, 83 Cornell L. Rev. at 1756, Table D1.
Looking Deathworthy, 17 Psychological Science at 384-85 & Figure 2.